Smartrise C4 Monitoring
Application to monitor the status of your elevators
Project Type: Website
Timeline: 6 weeks
Team: (1) Developer (1) Designer
Tools: Adobe Illustrator, Adobe XD
Project Overview
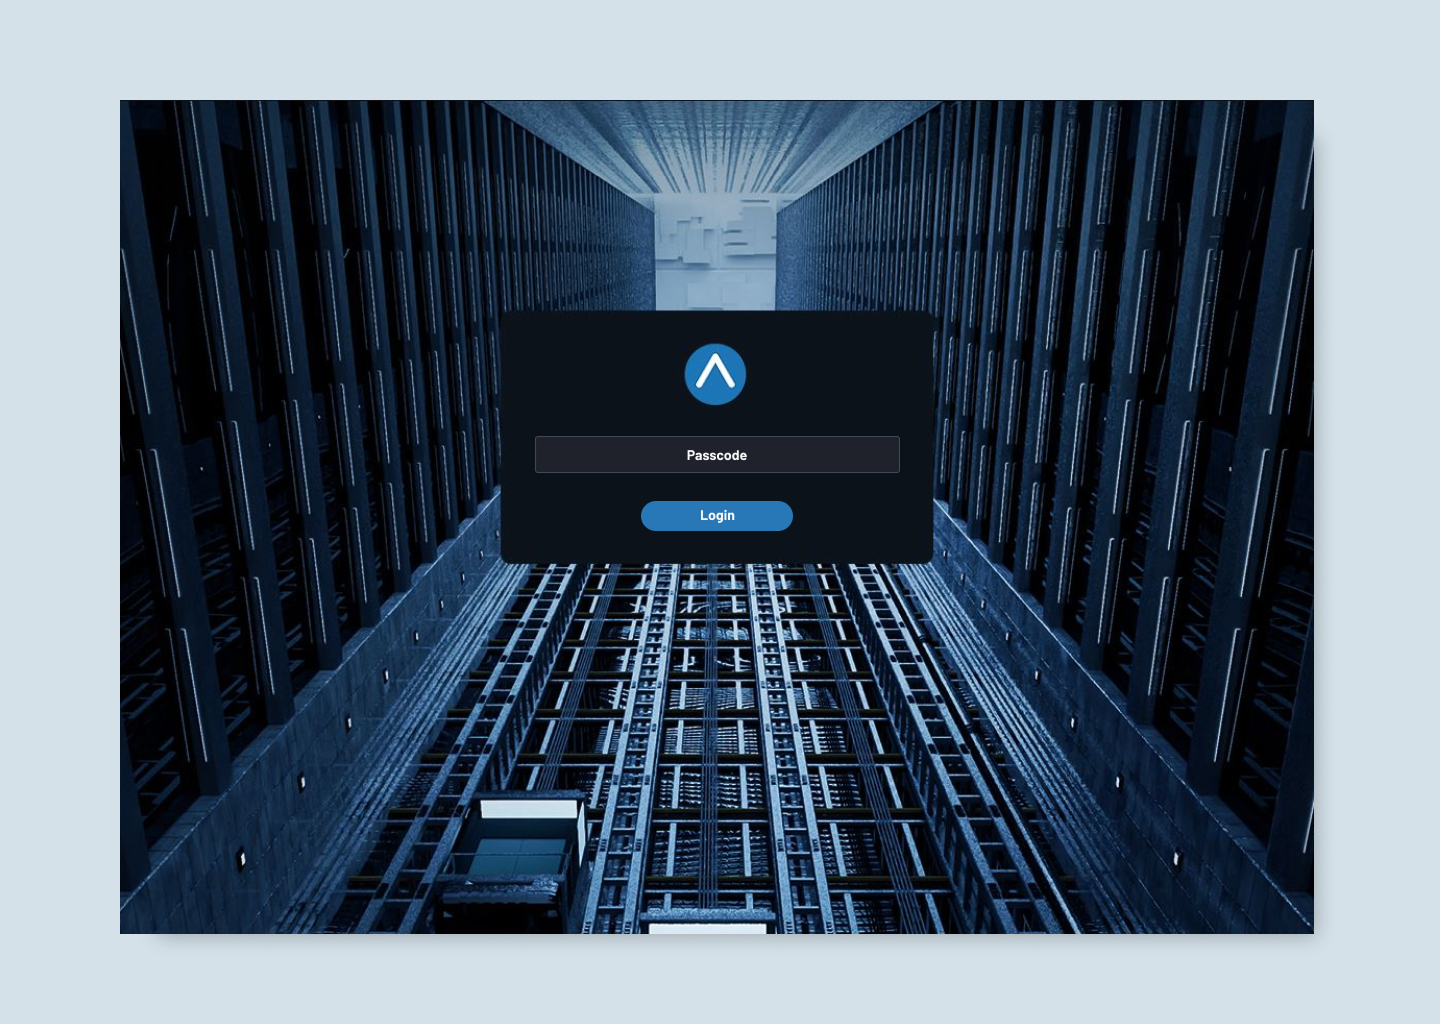
The Smartrise C4 platform allows elevator technicians and building owners to monitor and manage elevator systems through a centralized interface. The platform connects directly to elevator controllers, providing visibility into system performance, operational activity, and maintenance data.
The goal of this project was to design a streamlined interface that simplifies complex elevator data and supports both technical users configuring controllers and building owners monitoring elevator performance across their properties.
The Challenge
Elevator systems generate large volumes of operational data including call logs, system faults, and traffic activity. Mechanics need fast access to technical configuration settings and diagnostics, while building owners need a simpler way to monitor elevator status and review performance.
The challenge was designing an interface that supports both technical workflows and high-level monitoring without overwhelming users with unnecessary complexity.
My Role
I led the UX and interface design for the platform, focusing on improving usability and simplifying access to critical system data.
My work included user research, persona development, user journey mapping, wireframing, and interface design. I collaborated closely with engineers and stakeholders to translate complex elevator system functionality into an intuitive digital interface.
Stakeholder Collaboration
Worked closely with the Smartrise team to understand how the controllers work, what are the goals of both user types and what they would like to achieve with this monitoring system.
User Personas

- Quickly access technical manuals and troubleshooting guides on-site.
- Get fast and reliable customer support for installation and repairs.
- Access firmware updates and spare parts with minimal downtime.
- Difficulty finding specific manuals on the website.
- Long response times when requesting tech support.
- Needs mobile-friendly access to documents and resources while on the job.
- Company website (technical manual section)
- Mobile device (on-site access)
- Phone support or live chat
- Community forums for troubleshooting tips

- Tenant Satisfaction: Keeping elevator “uptime” at 99% to avoid complaints from high-rent tenants.
- Budget Predictability: Using data to move from “reactive” repairs (expensive) to “preventive” maintenance (cheaper).
- Compliance: Having a digital trail of logs for annual safety inspections and insurance requirements.
- The “Black Box” Problem: Feeling like she is at the mercy of the elevator company’s timeline and pricing because she doesn’t understand the equipment status.
- Emergency Liability: The nightmare of a “trapped passenger” scenario and the legal/PR fallout.
Wireframing & User Flow: Created wireframes that focused on simplifying the quote request process, making product information easy to find, and ensuring that support resources were easily accessible.
User Journey Flow: based on two primary user personas: Building Owners (Shopping & Buying Elevator Controllers) and Engineers (Accessing Technical Manuals & Support)
1. Engineers – Diagnosing & Fixing a Fault
Scenario: A “Critical Fault” alert is triggered on a Smartrise controller.
| Stage | 1. Awareness | 2. Consideration | 3. Interaction | 4. Resolution | 5. Post-Engagement |
| User Goal | Receive immediate notification of a breakdown. | Determine if the site needs an emergency visit. | Remotely access real-time controller data/I/O logs. | Clear the fault and verify the elevator is back in service. | Log the repair and update the preventive maintenance schedule. |
| Touchpoints | SMS alert, mobile push notification, email. | Dashboard overview, “Active Faults” list. | Remote Monitoring UI, Terminal Emulator, I/O Status screen. | “Clear Fault” command (remote or local), live car position tracker. | Digital work order, system health log. |
| Pain Points | Delayed alerts; vague “System Error” messages with no context. | Unsure if the car is stuck with passengers or just out of service. | High latency in data; hard-to-read I/O maps on a small phone screen. | Fault clears but recurs 10 minutes later (intermittent issue). | Manually typing in logs that the system should have captured. |
| Opportunities | Push alerts with fault descriptions and “Car Occupied” status. | Link directly to the specific digital manual page for that error code. | Visual I/O mapping (green/red lights) instead of just text logs. | Remote Reset capabilities for non-safety-critical glitches. | Auto-generate a report showing the “before and after” voltage/state. |
2. Building Owner – Monitoring Portfolio Performance
Scenario: Weekly review of building operations and maintenance costs.
| Stage | 1. Awareness | 2. Research | 3. Selection | 4. Purchase | 5. Post-Purchase |
| User Goal | Check overall “Health Score” of the building’s elevators. | Compare current downtime vs. last month’s performance. | Review maintenance logs to verify the mechanic’s bill. | Confirm all elevators are operational for a high-traffic event. | Share “Uptime Report” with stakeholders/investors. |
| Touchpoints | Weekly automated email report, login dashboard. | Trend graphs (bar/line charts) of system uptime. | Maintenance history tab, technician arrival/departure logs. | “All Systems Green” status indicator. | PDF Export, “Share with Team” button. |
| Pain Points | Overwhelmed by technical jargon they don’t understand. | Hard to see if they are getting “value for money” from their service contract. | Difficult to find specific dates or events in a long list. | System says it’s fixed, but tenants are still complaining. | Can’t easily export data for board meetings. |
| Opportunities | Executive Summary view (High-level KPIs: Uptime %, Total Trips). | Predictive Analytics (e.g., “Door operator showing wear; service recommended”). | Transparent logging of when a technician was actually on-site. | Tenant Communication tools (Estimated time to repair). | One-click ROI reports showing reduced energy or repair costs. |
Key Takeaways for UX Improvements
For the Field Engineer (The Expert)
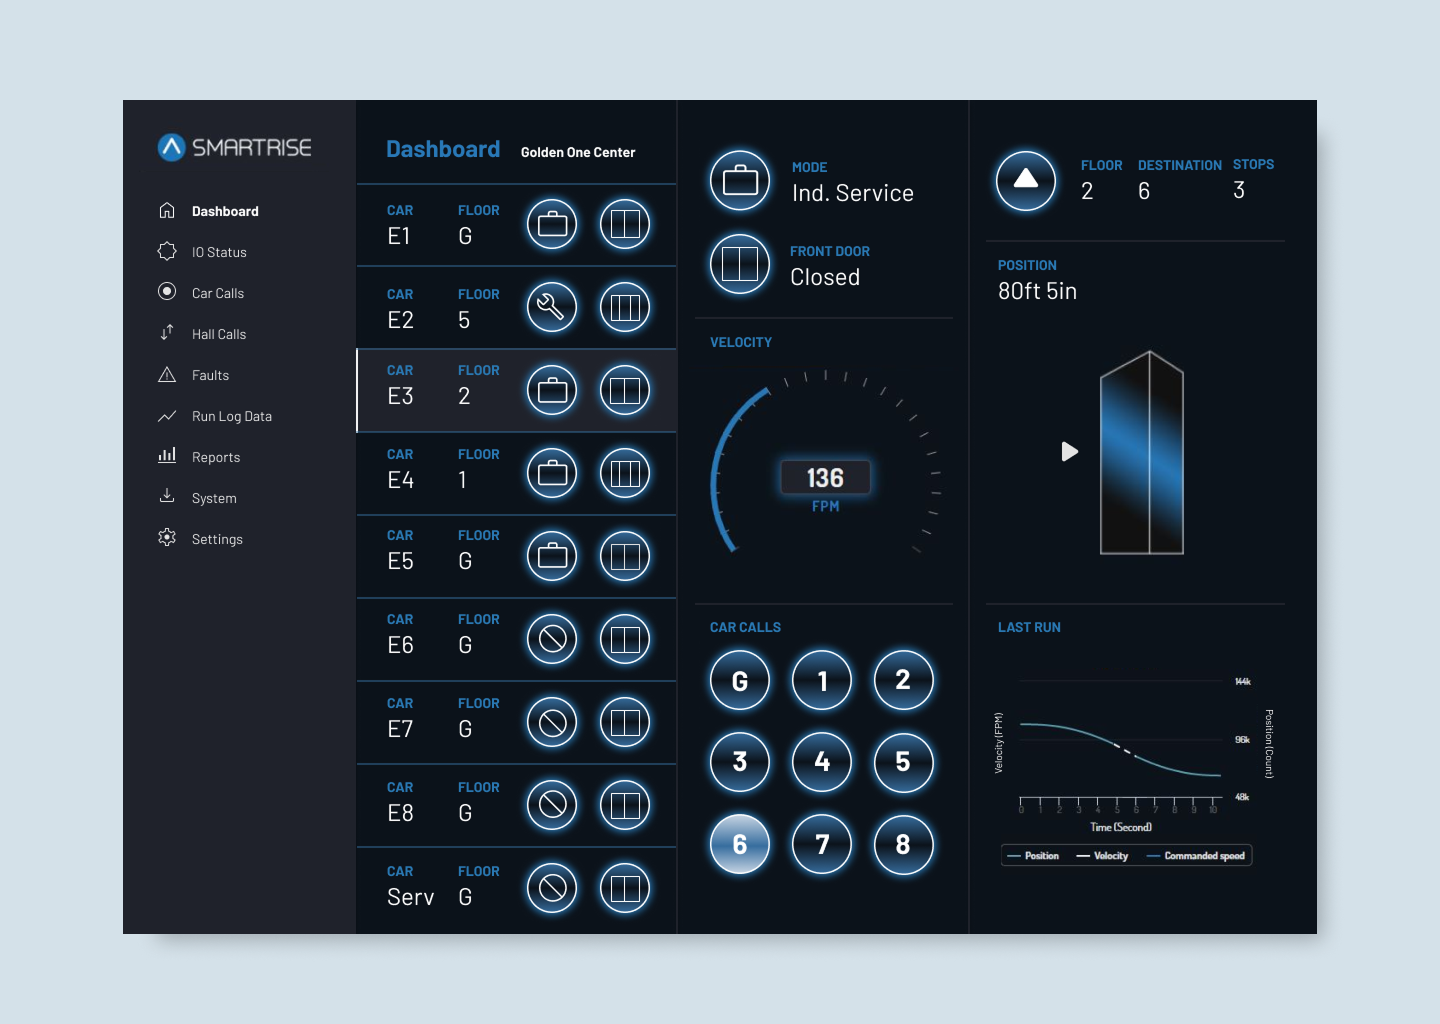
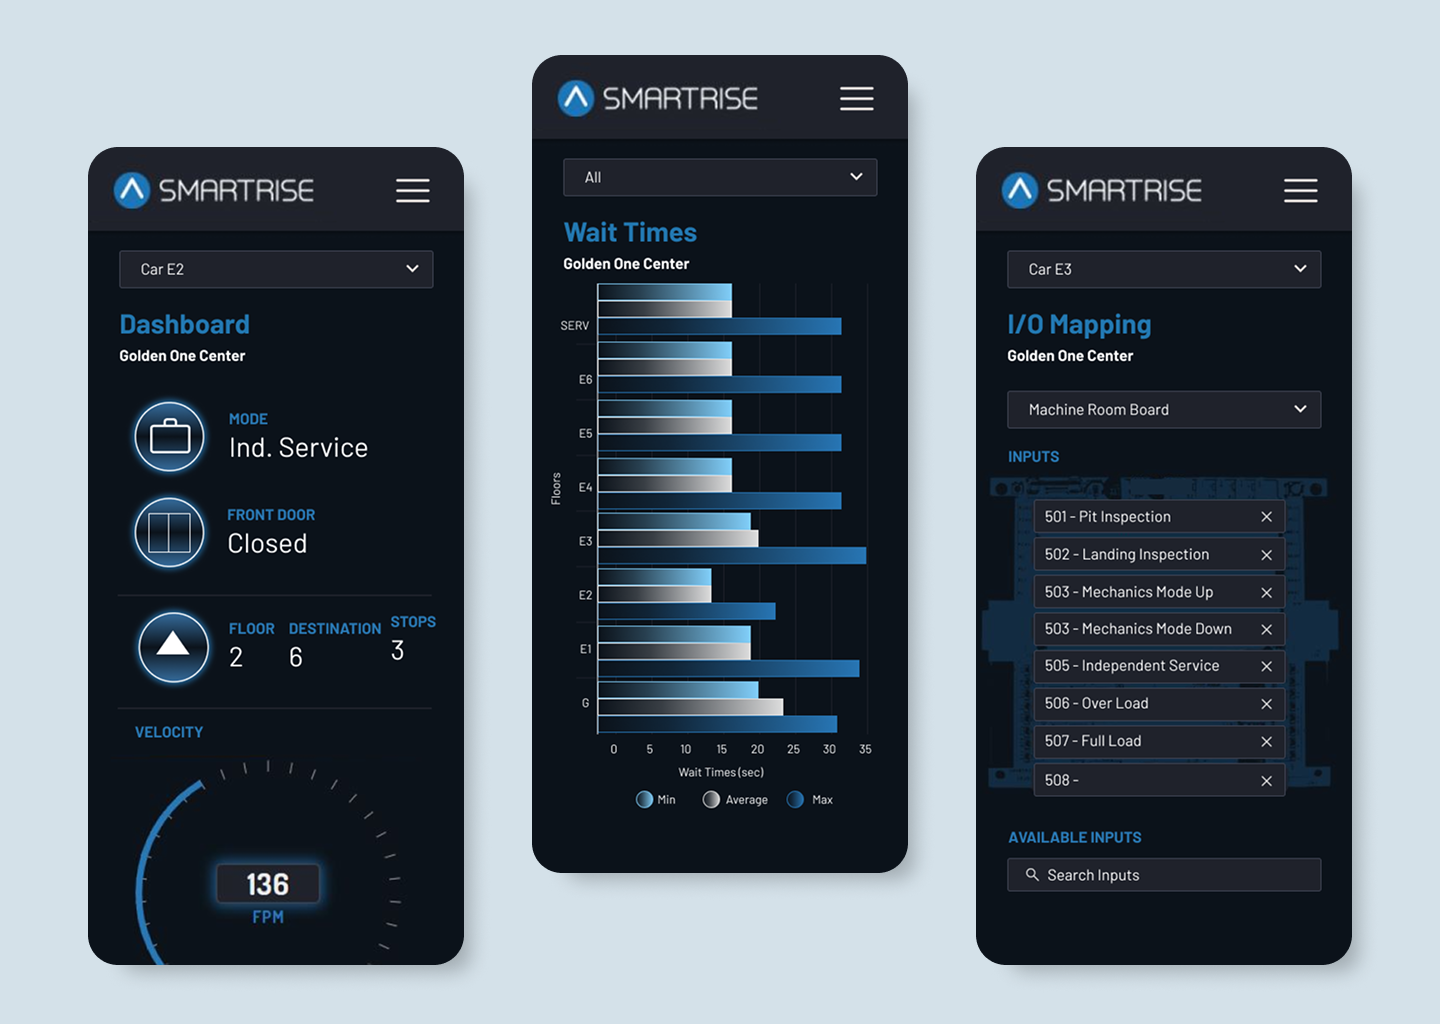
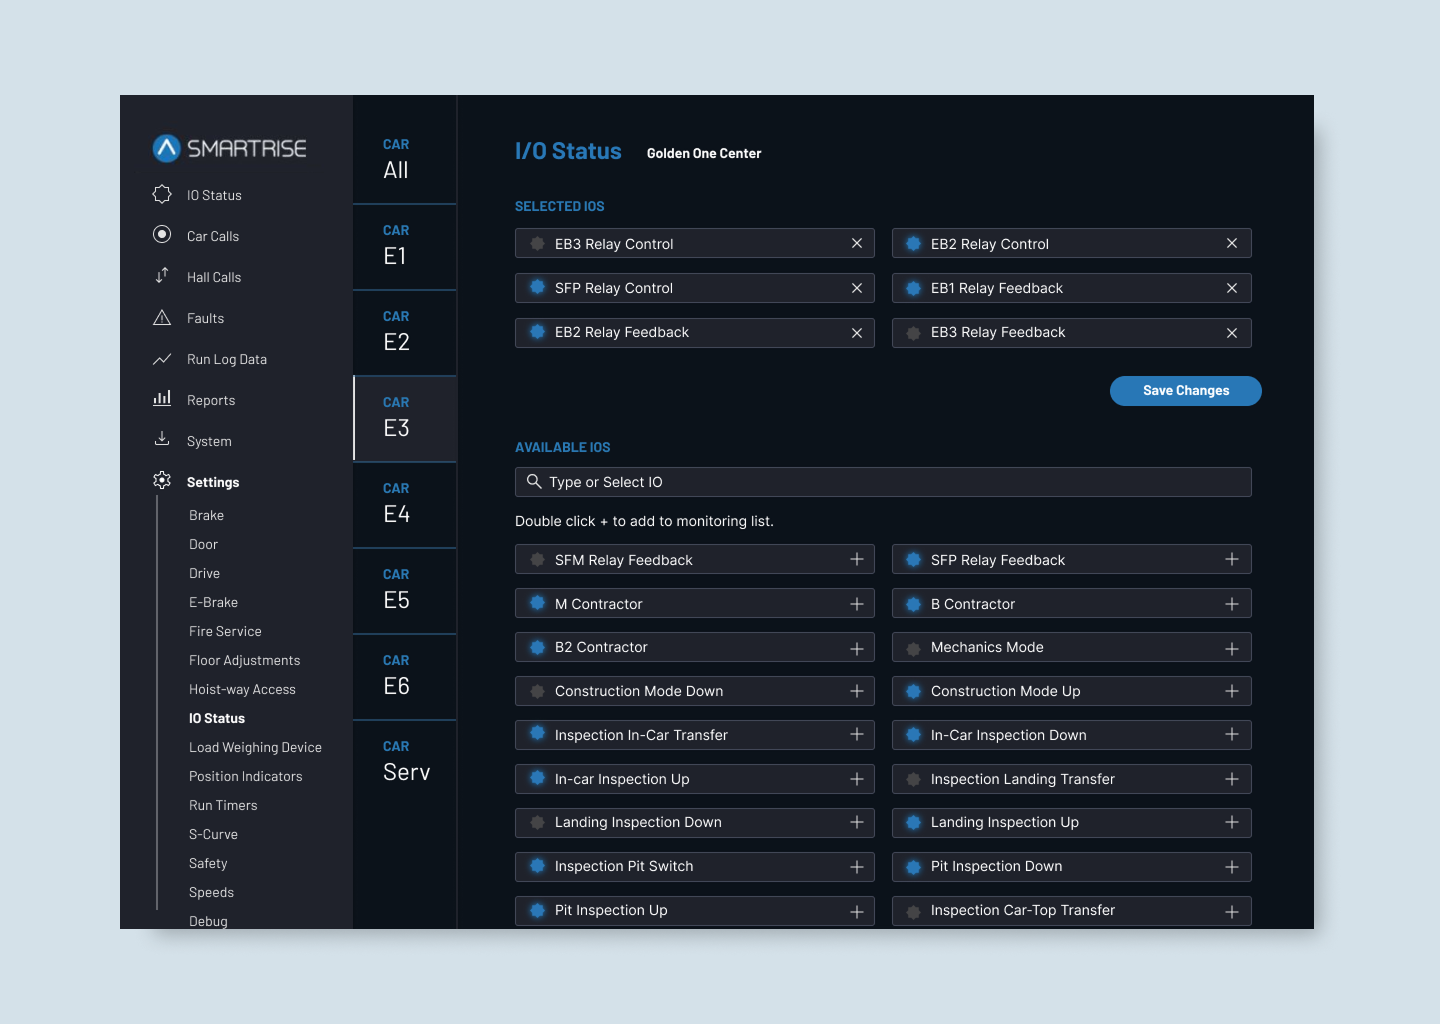
- Visual Diagnostics: Use color-coded I/O mapping (Red/Green) instead of text logs for faster at-a-glance troubleshooting.
- Actionable Alerts: Replace vague error codes with descriptive status updates (e.g., “Critical Fault – Car Occupied”).
- Instant Documentation: Link error logs directly to specific manual pages to speed up on-site repairs.
For the Building Owner (The Stakeholder)
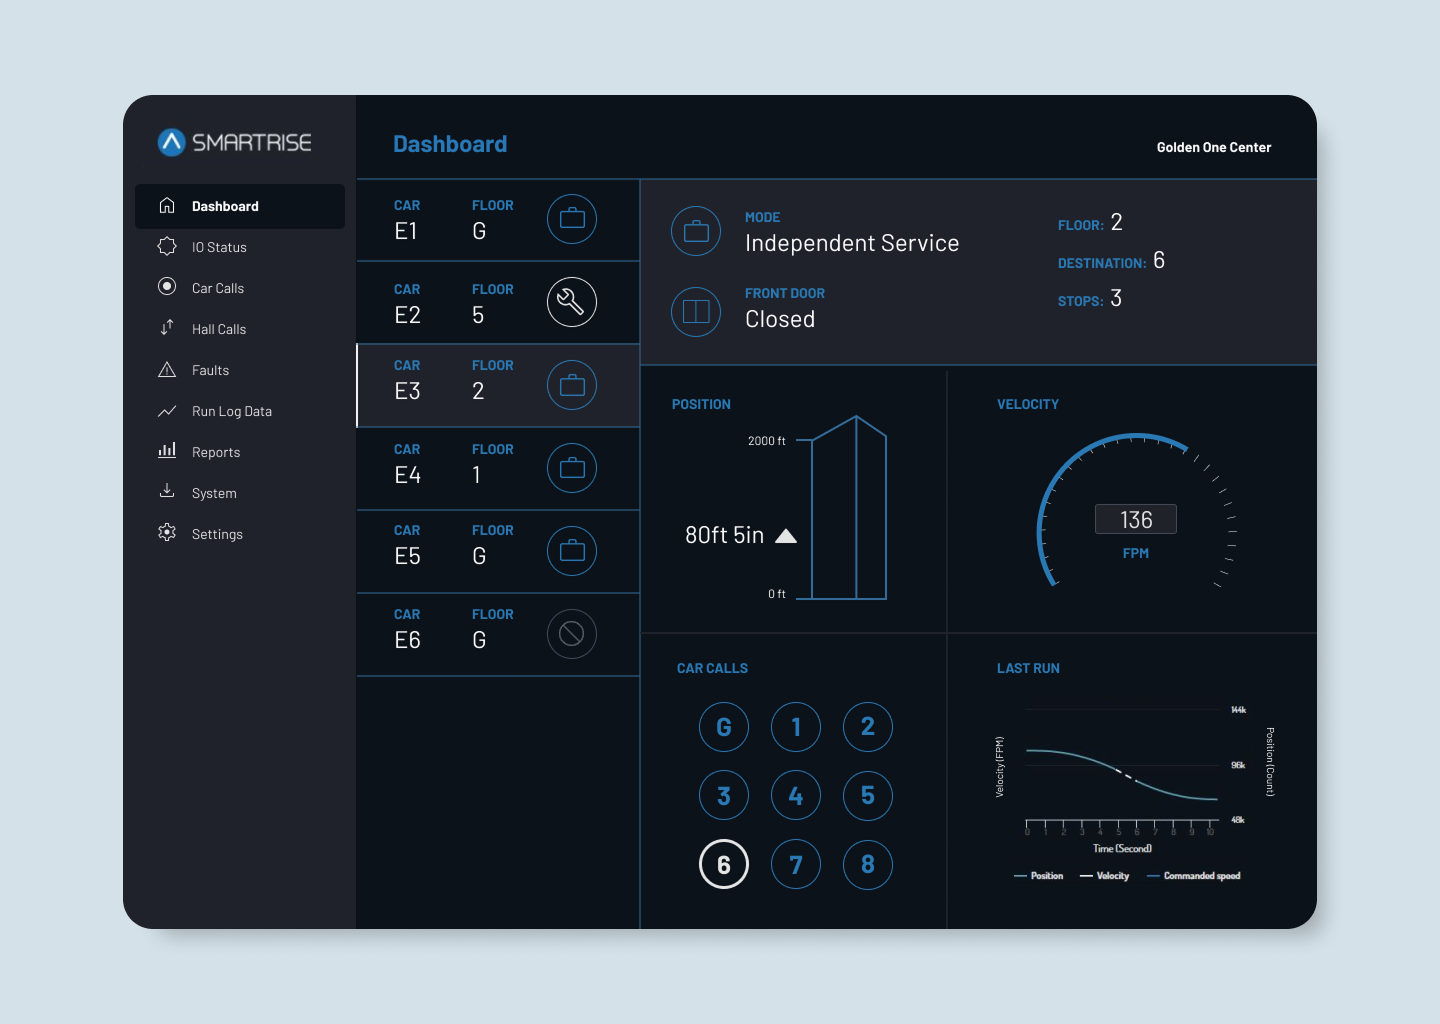
- Simplified Dashboards: Translate technical data into “Health Scores” and “Uptime %” for quick oversight.
- Maintenance Transparency: Provide clear logs of technician visits to justify service costs and verify repairs.
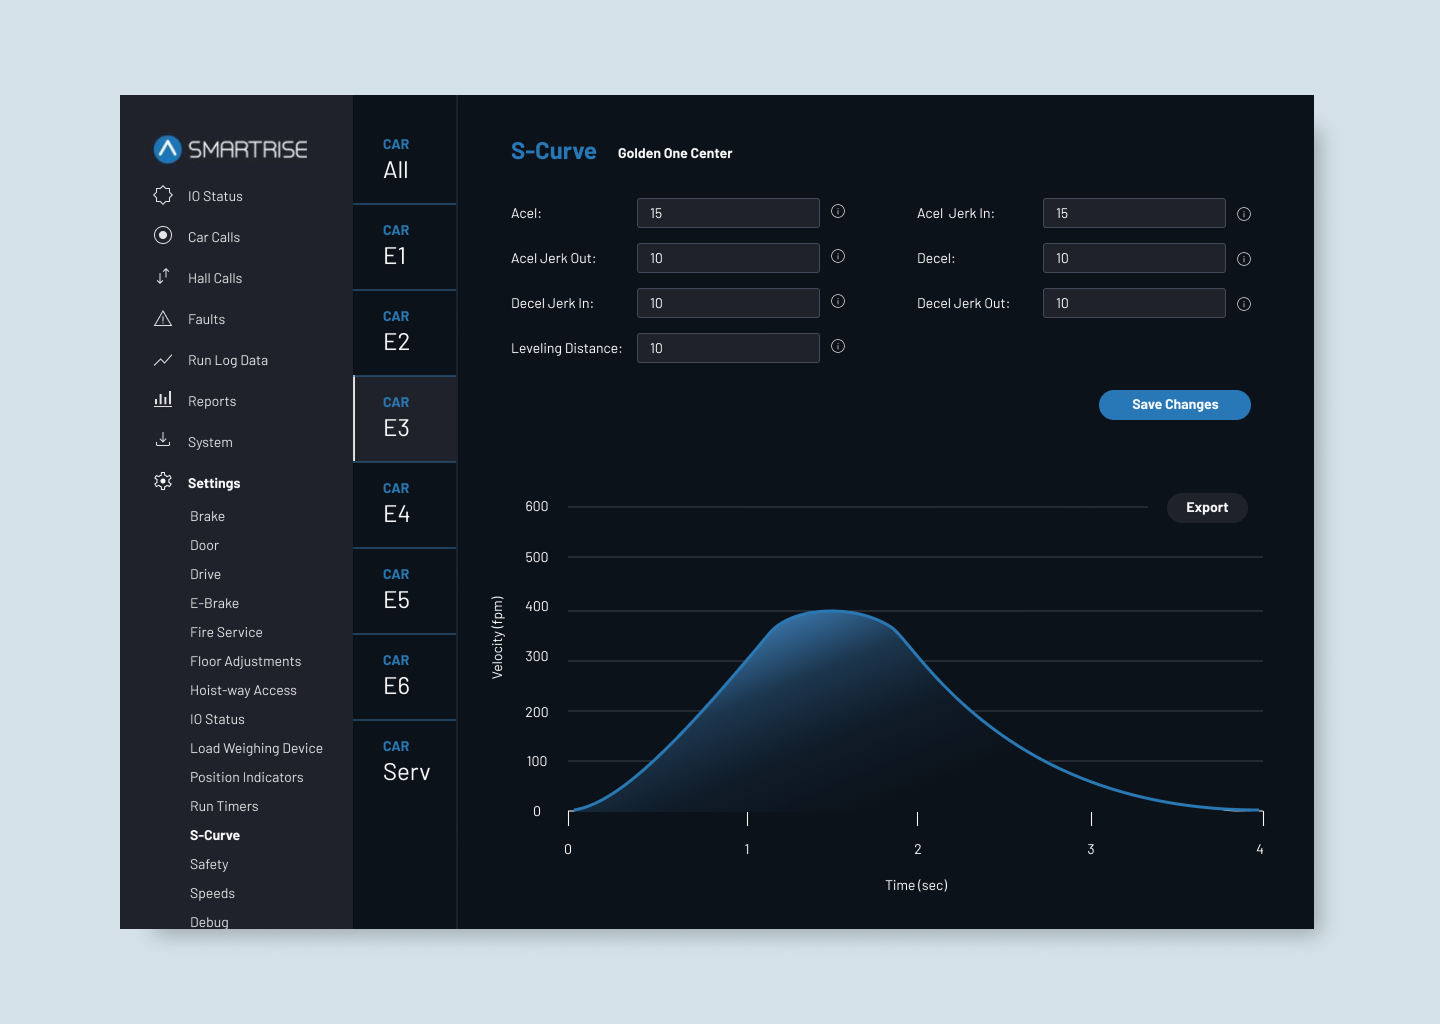
- Predictive Insights: Use data trends to move from expensive reactive repairs to planned, preventive maintenance.
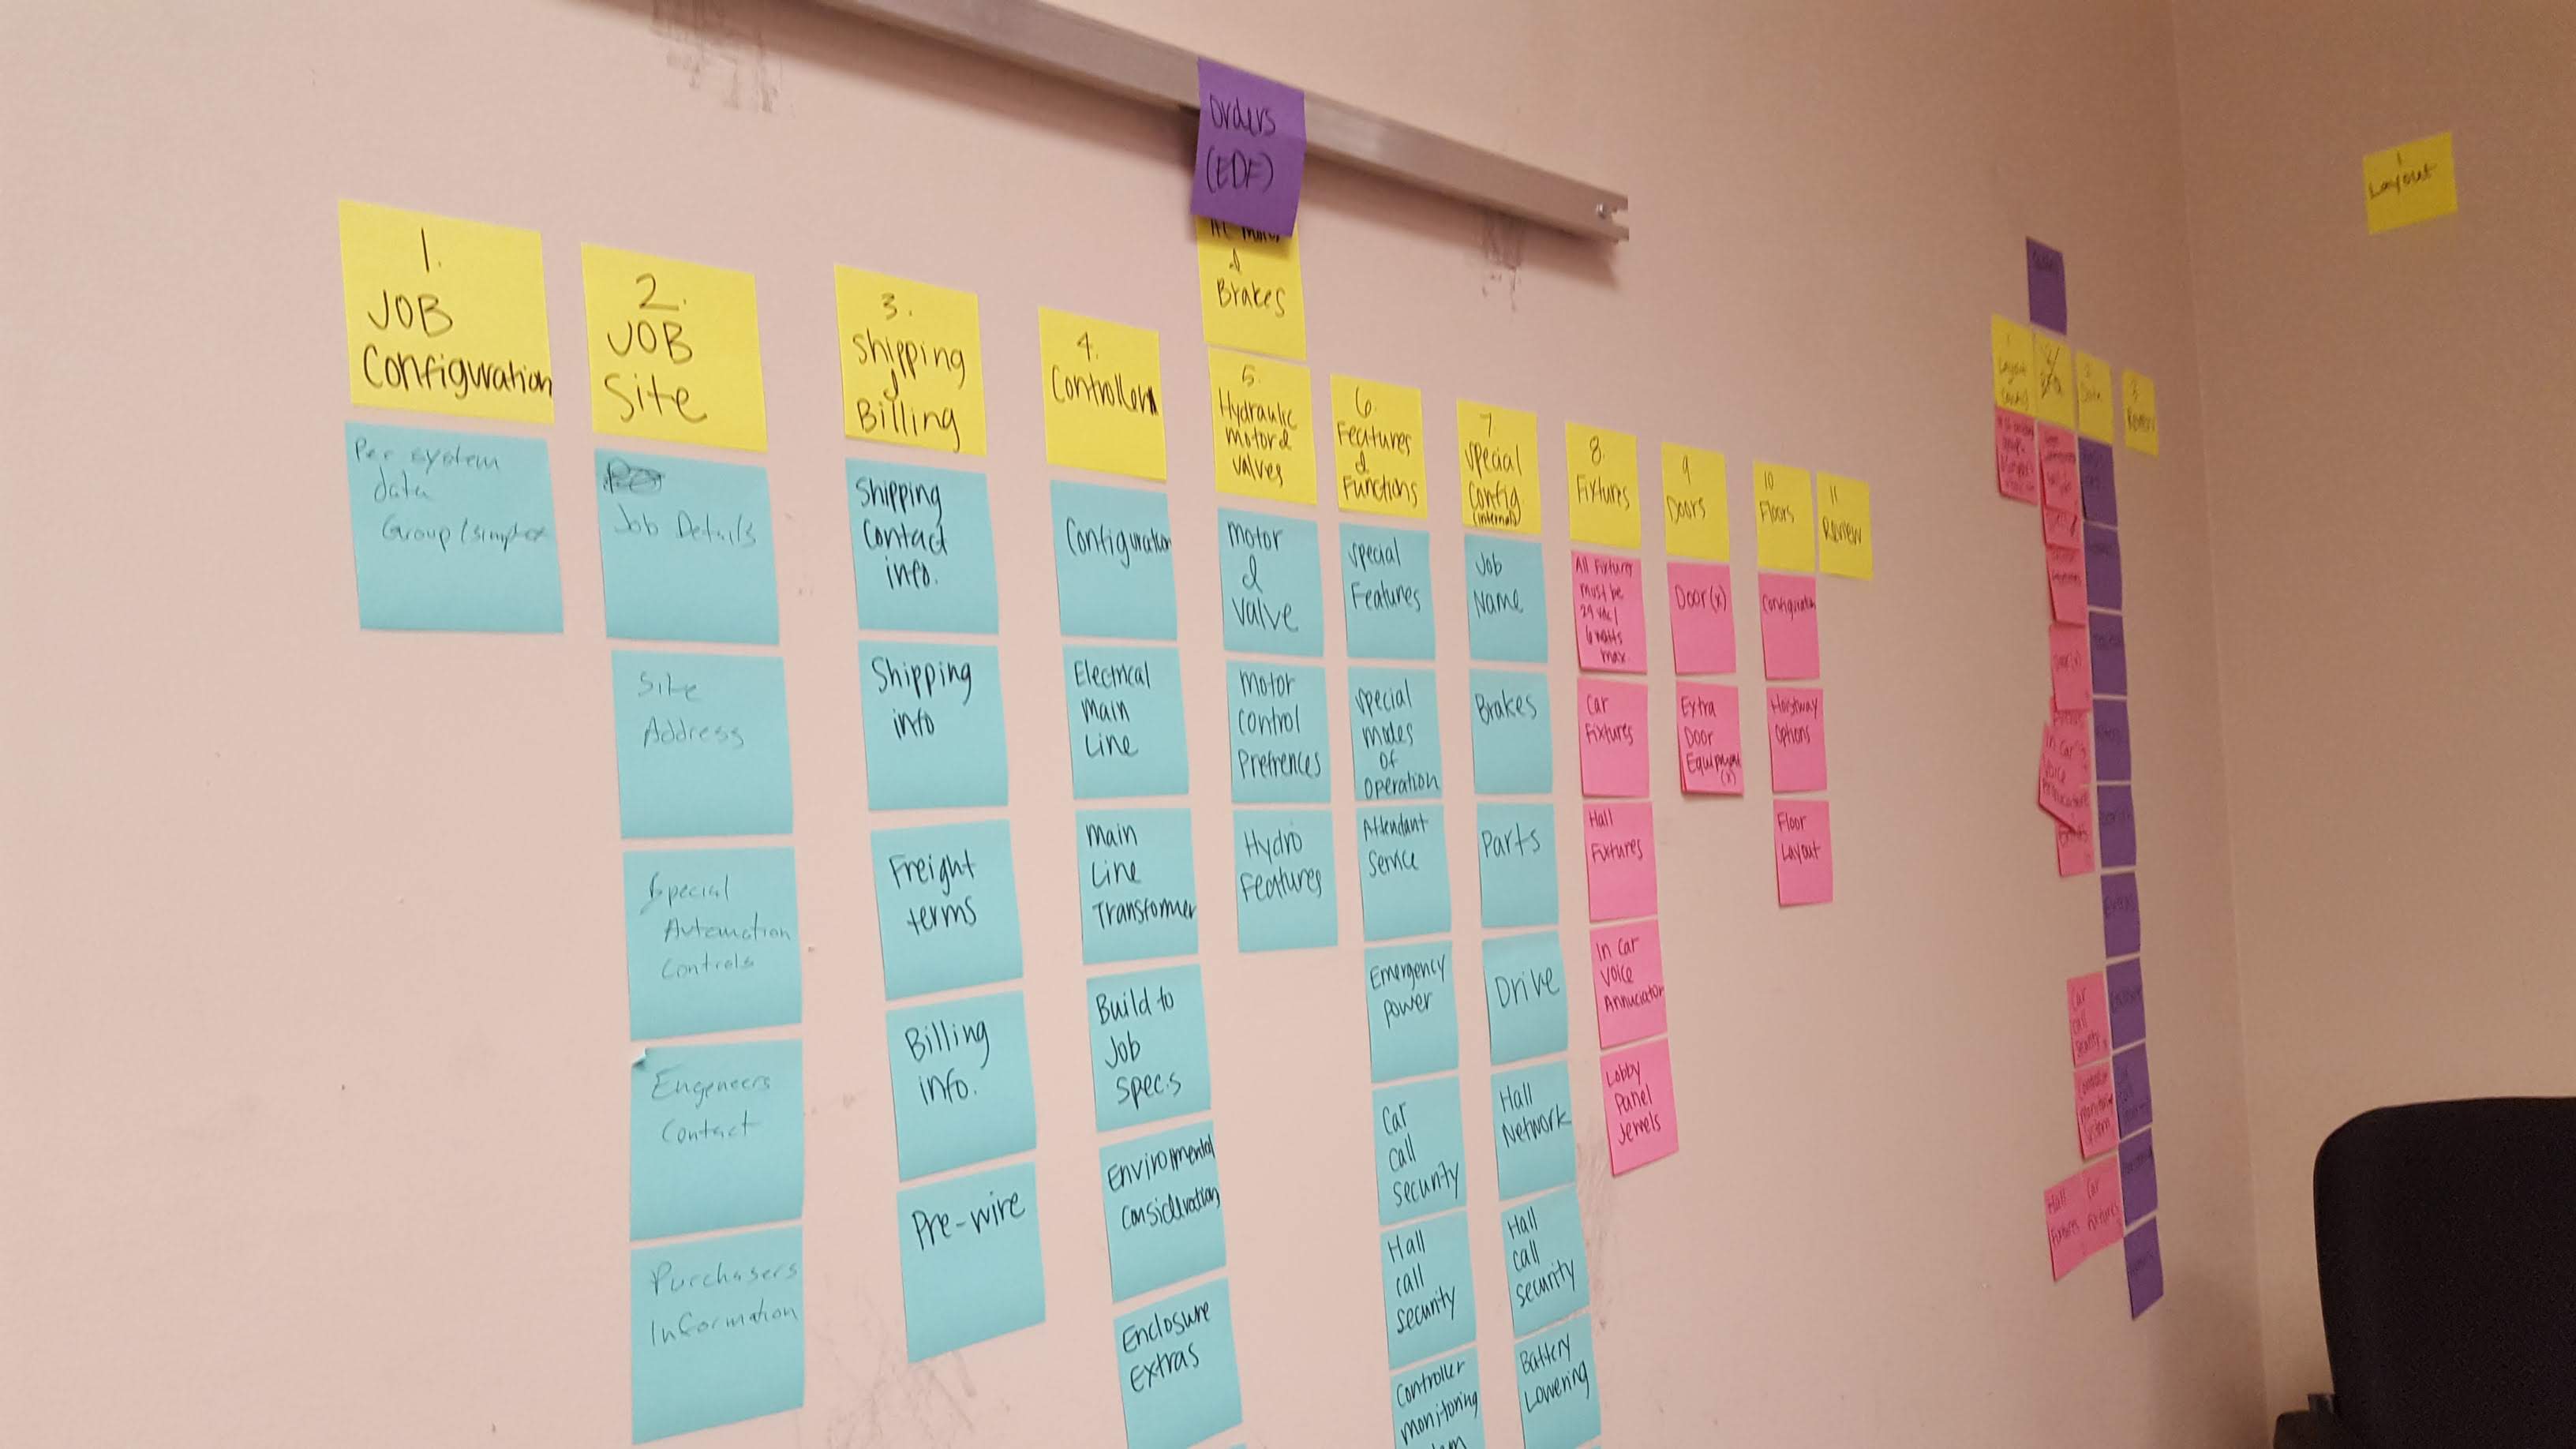
Discovery & Requirement Mapping
Synthesizing stakeholder requirements and technical constraints during the discovery phase. This session helped prioritize the dual-interface approach: high-level health scores for building owners and granular I/O mapping for field engineers.
Results
The redesigned interface improved usability for both technicians and building stakeholders by making system information easier to access and understand.
Technicians were able to locate configuration settings and diagnostics more efficiently, while building owners gained clearer visibility into elevator activity and system performance through simplified dashboards and reporting tools.
The platform created a more streamlined experience for monitoring elevator systems, helping teams quickly identify issues, review system activity, and manage elevator performance more effectively.